
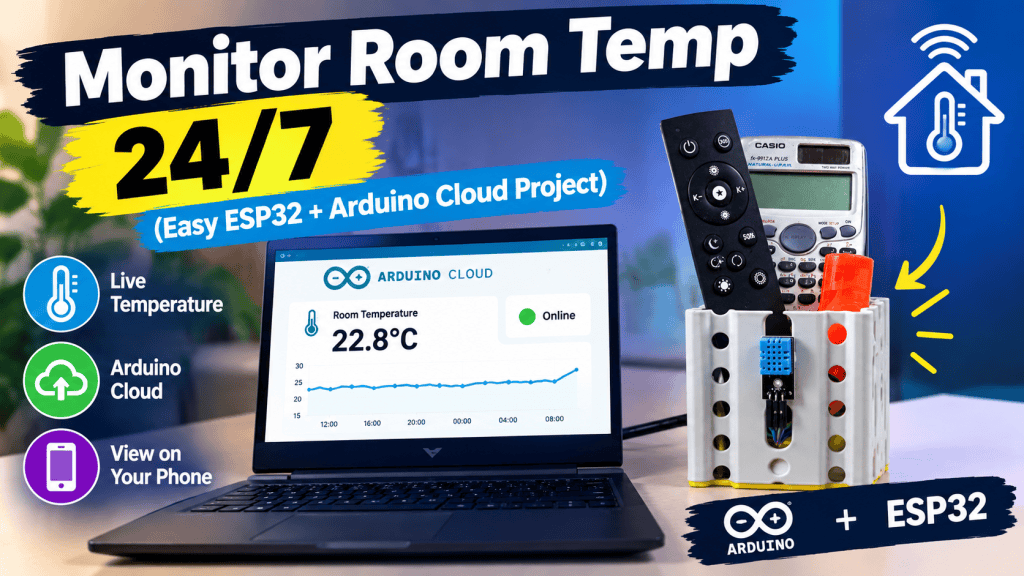
Welcome to the Smart Room Climate Monitor project! If you are just dipping your toes into robotics, microcontrollers, or the Internet of Things (IoT), building an internet-connected temperature and humidity sensor is hands-down one of the best ways to get started.
You can watch the video tutorial here:
In this tutorial, we aren’t just hooking up a basic thermometer. We are going to build a smart Wi-Fi device that streams live climate data straight to your phone or computer. Because different situations require different data, we will actually look at two different ways to program this project:
-
The Sleep Temperature Tracker: A smart setup that syncs with a real-time internet clock to know when night falls, silently logging the exact highest and lowest temperatures while you sleep.
-
The 24/7 Continuous Monitor: A simplified, always-on dashboard perfect for live-tracking a room’s climate all day and night.
This project isn’t just a coding exercise—it takes real-world problems and solves them with IoT. Have you ever woken up freezing at 3 AM, even though the room felt fine when you went to bed? The Sleep Tracker gives you the exact data you need to optimize your AC and blanket situation. Want to figure out which room in your house gets the hottest in the afternoon sun, or need to ensure a baby’s nursery stays in a safe, comfortable zone while you are in the living room? The Continuous Monitor has you covered.
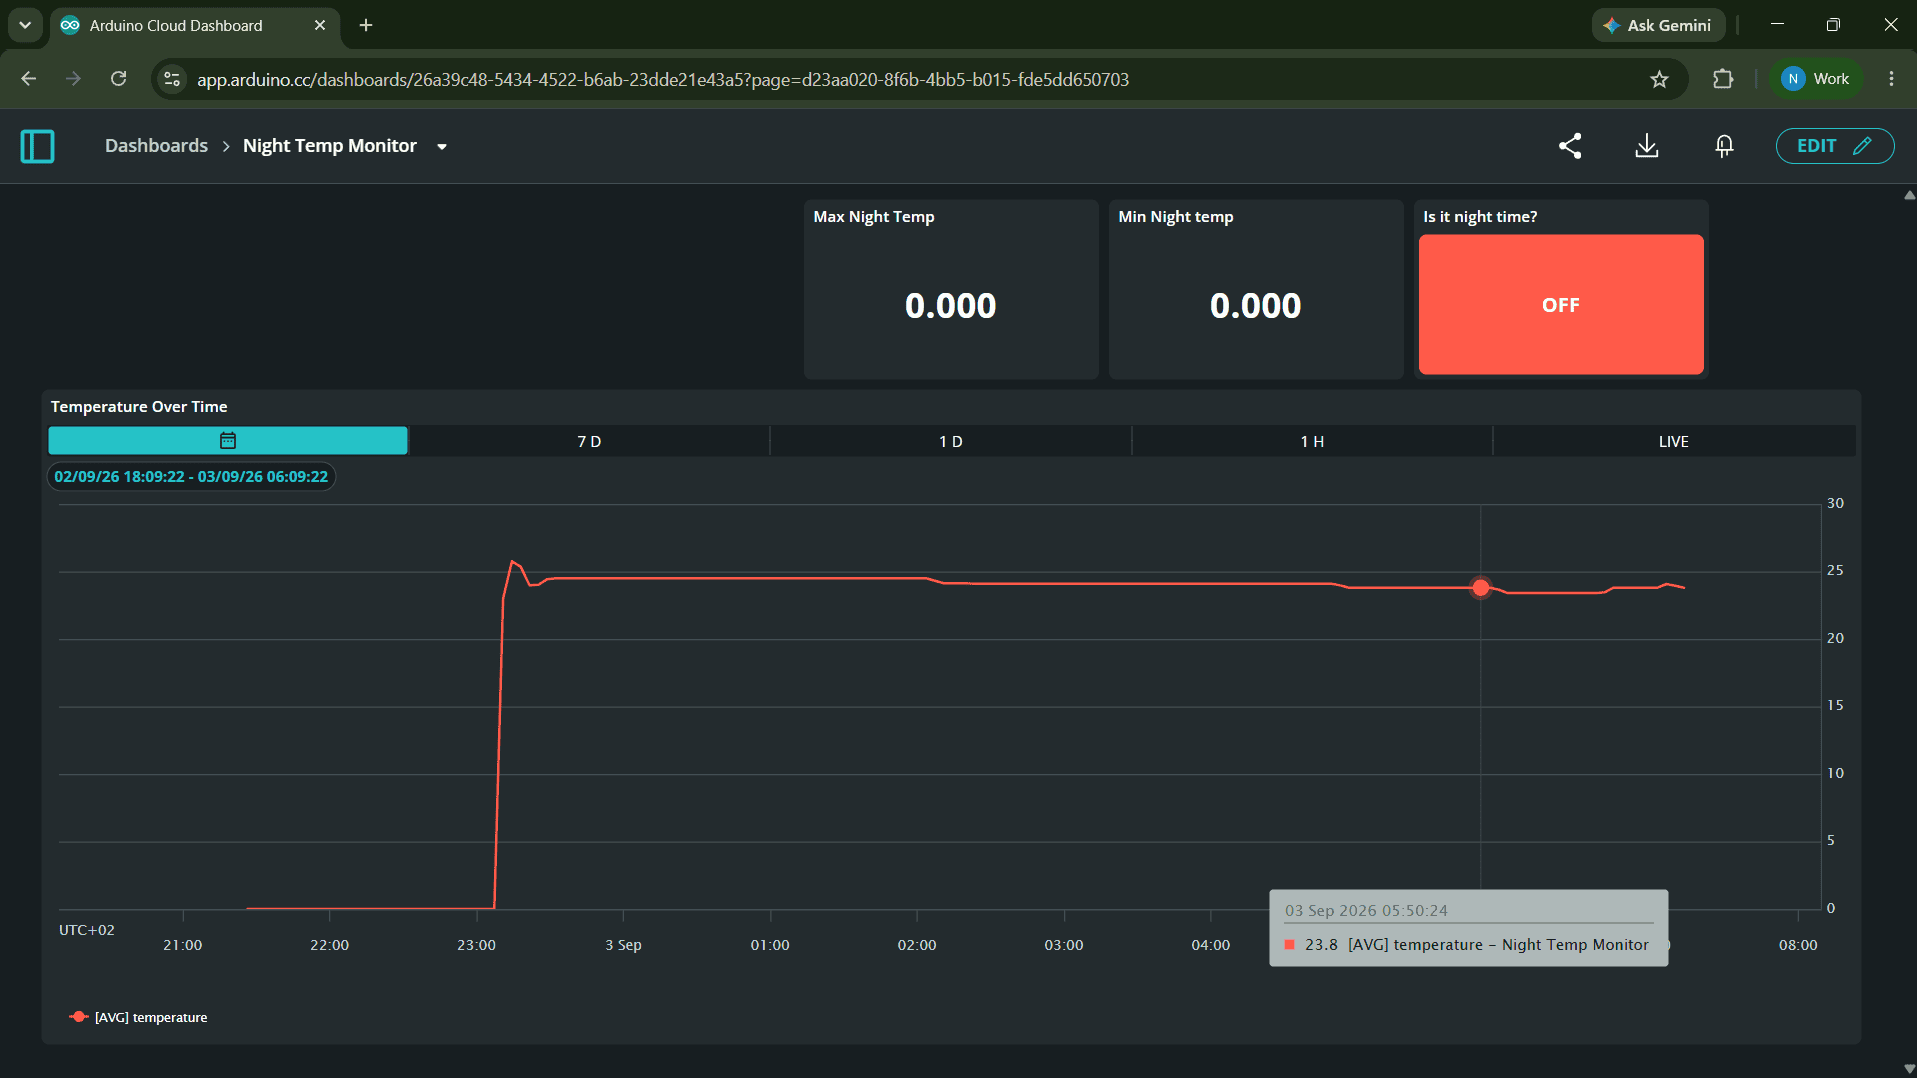
Take a look at the screenshot below to see the live monitoring dashboard you will have on your phone by the end of this guide!
Why Build a Night Temperature Monitor?
Why bother tracking temperature at night? Here are a few real-world ways this project is actually used:
-
Solving the 3 AM Shivers: Ever wonder why you wake up freezing in the middle of the night, even if the AC is set to a normal temperature? Your body temperature naturally drops while you sleep. By graphing your room’s temperature, you can figure out the perfect thermostat schedule.
-
Baby Room Monitoring: Infants are very sensitive to temperature changes. A live dashboard lets parents ensure the nursery stays in the safe, comfortable zone (usually around 20-22°C) without having to open the door and wake the baby.
-
Pet and Plant Care: Reptile enclosures and sensitive greenhouse plants need specific temperature drops at night. This tool lets you guarantee those conditions are being met.
While the ‘Sleep Scientist’ night-tracking logic is great, sometimes you don’t need to overcomplicate things. Included later in this tutorial is an alternative, stripped-down section for those who just want to monitor temperature and humidity continuously, 24/7.
This continuous setup is perfect if you want to keep an eye on your home office comfort, monitor a sensitive greenhouse, or even place a few of these devices in different rooms to finally settle the debate on which side of the house gets the warmest in the afternoon sun! Skip further down the page to find the simplified ‘Always-On’ version of this project—no time-zone coding required.
What You Need
-
1x ESP32 Microcontroller: The “brain” of our project, complete with built-in Wi-Fi.
-
1x DHT11 Sensor: The classic blue sensor that reads both temperature and humidity.
-
Jumper Wires: To connect everything together without soldering.
- Box or Stationery holder (optional): To place everything inside neatly
How to Build It
Building this involves two main phases: connecting the physical wires, and setting up the “cloud” so we can see our data from anywhere.
The Code
Make sure you have installed the DHT sensor library by Adafruit in the web editor’s library manager before uploading!
C++
/*
  The Sleep Scientist: Night Temperature Monitor
*/

#include "thingProperties.h"
#include <DHT.h>
#include "time.h"

#define DHTPIN 32     // Safe GPIO pin 32
#define DHTTYPE DHT11 // The blue DHT11 sensor

DHT dht(DHTPIN, DHTTYPE);

// --- Time Zone Settings ---
const char* ntpServer = "pool.ntp.org";
const long  gmtOffset_sec = 7200; // Timezone offset in seconds (Set to UTC+2 here)
const int   daylightOffset_sec = 0;

// Internal variable to track when night starts/stops
bool wasNight = false;

void setup() {
  Serial.begin(115200);
  delay(1500);

  initProperties();
  ArduinoCloud.begin(ArduinoIoTPreferredConnection);
  setDebugMessageLevel(2);
  ArduinoCloud.printDebugInfo();

  dht.begin();

  // Connect to the internet time servers
  configTime(gmtOffset_sec, daylightOffset_sec, ntpServer);
  Serial.println("Time configured. Waiting for sync...");
}

void loop() {
  ArduinoCloud.update();

  static unsigned long lastReadTime = 0;

  // Run this block every 10 seconds
  if (millis() - lastReadTime > 10000) {

    // 1. FIRST: Check the time
    struct tm timeinfo;
    if (getLocalTime(&timeinfo)) {
      int currentHour = timeinfo.tm_hour; // Gets hour in 24hr format (0-23)

      // Check if we are  in the night window: 8 PM (20) or later, OR before 7 AM (7)
      bool isNightNow = (currentHour >= 20 || currentHour < 7);
      is_night_time = isNightNow; // Update the cloud dashboard indicator

      // Did night JUST start right now?
      if (isNightNow && !wasNight) {
        Serial.println("8:00 PM hit! Resetting min/max for the new night...");
        night_min_temp = 999.0;  // Reset high so the first reading becomes the minimum
        night_max_temp = -999.0; // Reset low so the first reading becomes the maximum
      }

      wasNight = isNightNow;
    }

    // 2. SECOND: Read the DHT11 Sensor
    float currentTemp = dht.readTemperature();
    float currentHum = dht.readHumidity();

    // Check if the sensor actually returned a real number
    if (!isnan(currentTemp) && !isnan(currentHum)) {

      // Update the main cloud variables
      temperature = currentTemp;
      humidity = currentHum;

      // If it is currently night time, check for new highs and lows
      if (is_night_time) {
        if (currentTemp < night_min_temp) {
          night_min_temp = currentTemp;
        }
        if (currentTemp > night_max_temp) {
          night_max_temp = currentTemp;
        }
      }

      Serial.printf("Temp: %.1f C | Hum: %.1f %%\n", currentTemp, currentHum);

    } else {
      Serial.println("DHT11 read failed! Check wiring.");
    }

    lastReadTime = millis();
  }
}
How the Code Works (in Plain English)
-
#include "thingProperties.h": This is the magic file Arduino Cloud generates in the background. It securely links your code to your Wi-Fi and your web dashboard. -
The Time Logic (
configTime&getLocalTime): Because the ESP32 doesn’t have a built-in battery to remember the time when it turns off, we use NTP (Network Time Protocol). It essentially asks a global atomic clock on the internet, “What time is it?” -
The Min/Max Logic: At exactly 8:00 PM, the code purposefully resets the “minimum” to an impossible 999°C, and the “maximum” to -999°C. This ensures that the very next reading (say, 22°C) instantly overwrites both of them, giving us a fresh slate for the new night!
-
isnan(): This stands for “Is Not A Number.” Sometimes sensors glitch. This line prevents our dashboard from crashing by saying: “If the sensor gives us a glitch instead of a number, ignore it and try again later.”
Alternative Setup: The 24/7 Continuous Monitor
What if you don’t care about the day/night cycle? Maybe you want to monitor a greenhouse, a server room, or just want a simple live thermometer on your phone that logs data 24 hours a day, 7 days a week.
If you want the easiest possible setup without messing with time zones, this version is for you.
Step 1: Simplify Your Cloud Variables
For this setup, you only need to create two variables in your Arduino Cloud Thing:
-
temperature(Type: Floating Point, Read Only, Update Periodically every 10s) -
humidity(Type: Floating Point, Read Only, Update Periodically every 10s)
Step 2: The “Continuous Monitor” Code
Because we aren’t tracking the time of day anymore, we can remove the atomic clock (NTP) settings. This makes the code incredibly short and beginner-friendly.
Replace the code in your sketch with this:
C++
/*
  24/7 Continuous Temperature & Humidity Monitor
  A simple, time-independent data logger
*/

#include "thingProperties.h"
#include <DHT.h>

#define DHTPIN 32     // Safe GPIO pin 32
#define DHTTYPE DHT11 // The blue DHT11 sensor

DHT dht(DHTPIN, DHTTYPE);

void setup() {
  Serial.begin(115200);
  delay(1500);

  // Initialize Arduino IoT Cloud properties
  initProperties();
  ArduinoCloud.begin(ArduinoIoTPreferredConnection);

  // Set debug level to see network connection status
  setDebugMessageLevel(2);
  ArduinoCloud.printDebugInfo();

  // Start the sensor
  dht.begin();
}

void loop() {
  // Keeps the ESP32 connected to the cloud
  ArduinoCloud.update();

  static unsigned long lastReadTime = 0;

  // Read sensors every 10 seconds
  if (millis() - lastReadTime > 10000) {

    float currentTemp = dht.readTemperature();
    float currentHum = dht.readHumidity();

    // Check if the sensor read was successful
    if (!isnan(currentTemp) && !isnan(currentHum)) {

      // Update the cloud variables
      temperature = currentTemp;
      humidity = currentHum;

      // Print to Serial Monitor for local debugging
      Serial.printf("Temp: %.1f C | Hum: %.1f %%\n", currentTemp, currentHum);

    } else {
      Serial.println("DHT11 read failed! Check wiring.");
    }

    lastReadTime = millis();
  }
}
Step 3: Set Up Your Dashboard Widgets
Once your code is uploaded and your ESP32 connects to Wi-Fi, go to the Dashboards tab in Arduino Cloud.
To get the best visual experience, add these widgets to your dashboard:
-
For Live Readings: Add two Gauge Widgets (one for temperature, one for humidity). You can set the Min and Max values on the gauges so the needle moves dynamically as the room changes.
-
For Historical Data: Add an Advanced Chart Widget. Link both the temperature and humidity variables to this single chart. Arduino Cloud will automatically log every reading with a timestamp, creating a beautiful continuous line graph that you can view for the past hour, day, or up to 15 days!
Pro Tip: If you ever need to analyze your continuous data for a school project, just click the little “Download” arrow on the Advanced Chart widget. It will instantly export all your temperature readings into a spreadsheet.
Common Troubleshooting
If things aren’t working on the first try, don’t panic! Here are the most common traps beginners fall into:
| The Problem | The Solution |
| Serial Monitor says “DHT11 read failed!” | You likely have a loose wire. Check that your DATA pin is securely connected to GPIO 32. |
| The dashboard isn’t updating at all | Check your Wi-Fi credentials in the Network tab. If your school or home uses a 5GHz Wi-Fi network, the ESP32 won’t see it (it only connects to 2.4GHz networks). |
The dashboard is stuck reading -999 |
You might have the wrong sensor type selected in the code. If you are using a white sensor (DHT22) but the code says DHT11, it will fail to read. |
| The time is wrong! | Check the gmtOffset_sec in the code. You need to multiply your timezone offset by 3600. For example, EST is UTC-5, so you would use -18000. |
Once your code is running, head over to the Dashboards tab in Arduino Cloud to create cool gauges, charts, and LED lights to visualize your data live!